14 Sep 2020
USD/CAD Price Analysis: Friday’s hanging man keep sellers hopeful below 1.3200
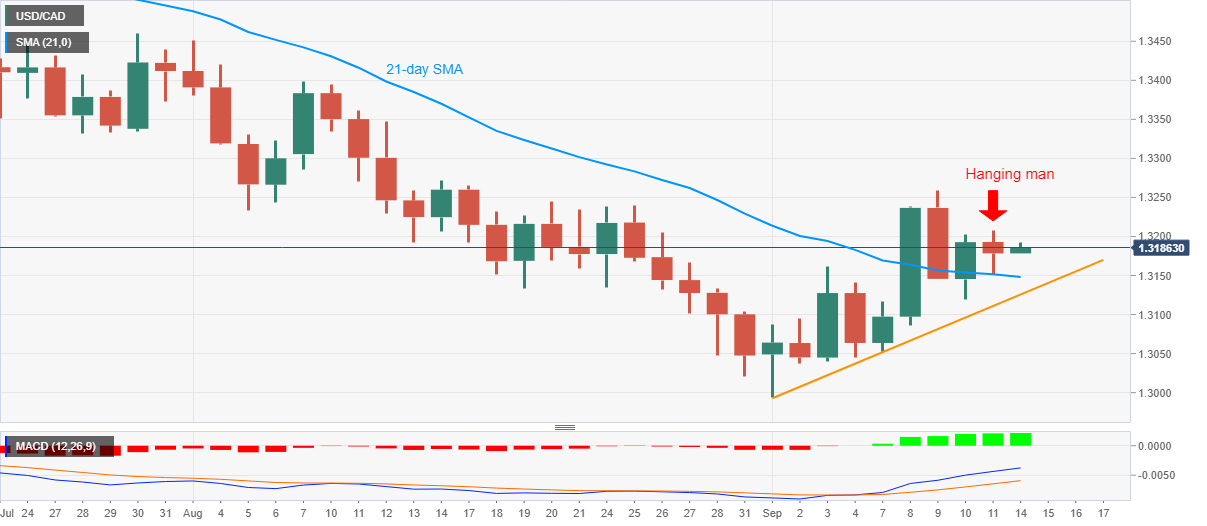
- USD/CAD attacks the lower-end of the 1.3192-74 trading range.
- 21-day SMA, monthly support line can question the bearish candlestick formation.
- Bulls may wait for a clear break of the monthly high before taking any major position.
USD/CAD seesaws around 1.3185 during Monday’s Asian session. The loonie pair flashed bearish candlestick, hanging man, on Friday, but bounced off 21-day SMA amid bullish MACD.
Other than the 21-day SMA level of 1.3148, sellers may struggle unless the quote declines below an ascending trend line from September 01, at 1.3125 now.
In a case where the sellers manage to dominate past-1.3125, the month-start top near 1.3085 and the 1.3000 psychological magnet will gain market attention.
On the contrary, an upside break of Friday’s top near 1.3210 will defy the bearish candlestick formation.
Though, bulls may have to wait for the month’s fresh high above 1.3260 before entering the long positions.
USD/CAD daily chart
Trend: Pullback expected