GBP/USD Price Analysis: Overbought RSI triggers pullback from one-week high
- GBP/USD refreshes intraday low while stepping back from 1.3223.
- 1.3185 can offer immediate support ahead of the key Fibonacci retracements.
- A six-day-old falling trend line restricts immediate upside.
GBP/USD declines to 1.3207, intraday low of 1.3206, during the early Thursday’s trading. In doing so, the Cable snaps two-day winning streak while reversing from the one-week top.
Considering the RSI conditions and the pair’s multiple failures to stays past-1.3200, the August 06 high of 1.3185 as immediate support ahead of Tuesday’s peak near 1.3170.
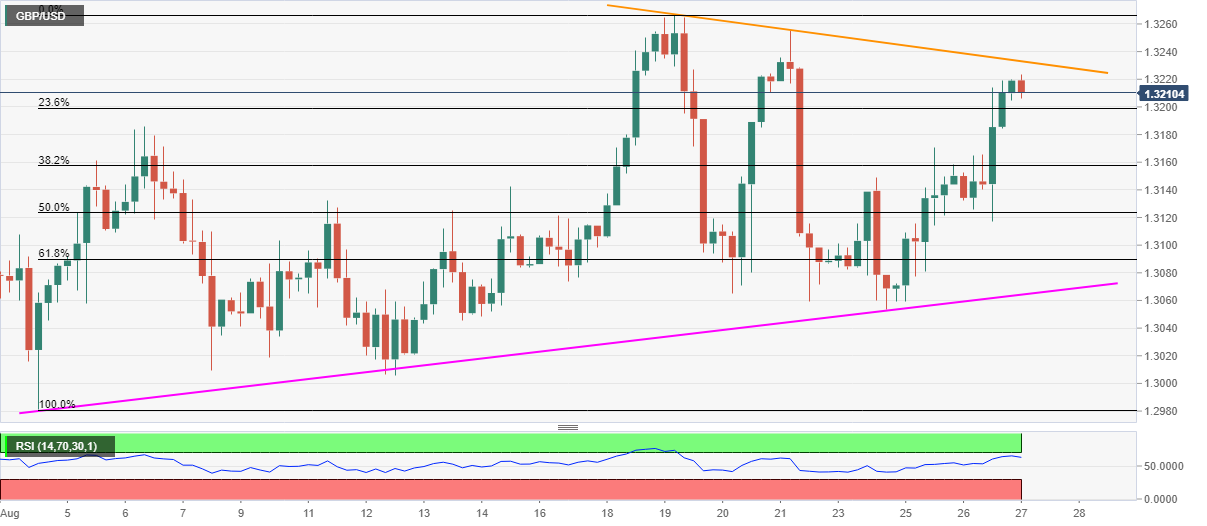
Though, the pair’s extended weakness past-1.3170 will be challenged by 50% and 61.8% Fibonacci retracement levels around 1.3120 and 1.3090 respectively.
In a case where the sellers dominate past-1.3090, an ascending trend line from August 04, at 1.3064 now, will be the key.
Alternatively, buyers will wait for a clear break of the short-term resistance line, currently around 1.3235, before taking entries to target the monthly top near 1.3270.
GBP/USD four-hour chart
Trend: Pullback expected