GBP/USD Price Analysis: Portrays Head-and-Shoulders on 4-hour chart ahead of BOE
- GBP/USD bounces off Wednesday’s low surrounding 1.2510.
- Sellers need validation from the monthly support line for further downside.
- An upside clearance of weekly high will defy the bearish technical pattern.
GBP/USD recovers to 1.2560 during the early Asian session. The Cable pair dropped during the last two-days after reversing from the weekly high near 1.2688. However, the sellers are waiting for the confirmation of a bearish chart formation ahead of the key BOE monetary policy meeting.
Read: Bank of England Preview: Bailey may boost pound by going big on bond-buying, beware negative rates
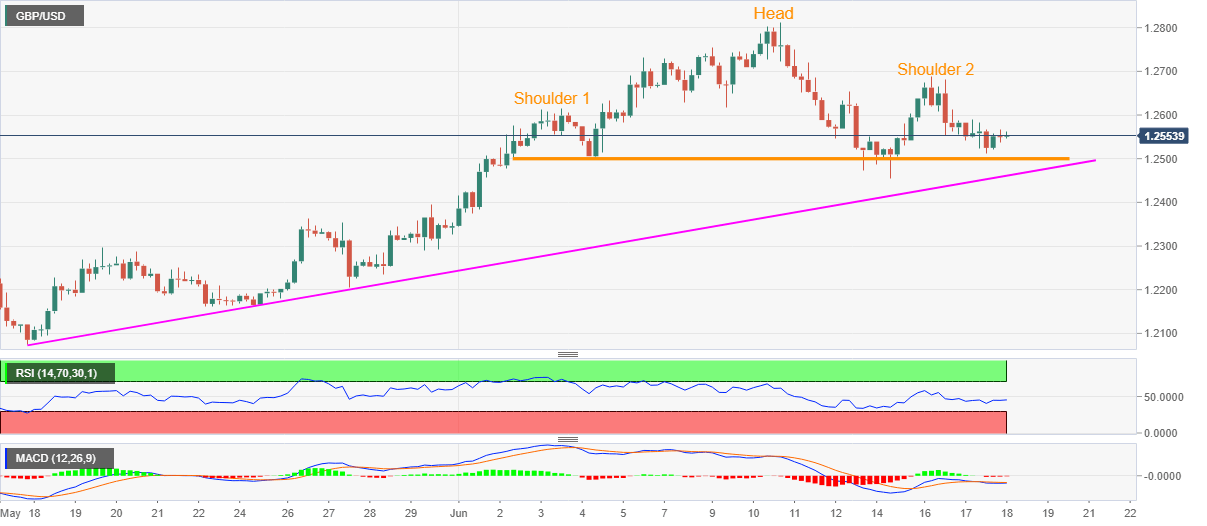
Other than the head-and-shoulder pattern’s neckline, at 1.2500 now, an ascending trend line from May 17, at 1.2460, also restricts the pair’s immediate downside.
Hence, a clear break below 1.2460 becomes necessary for the bears to target the theoretical aim of the sub-1.2200 mark, on the finalization of the bearish pattern. Though, May 26 high of 1.2633 and May 19 pear near 1.2300 could offer intermediate halts during the fall.
On the contrary, an upside clearance of the pair’s weekly top surrounding 1.2688 will pour cold water on the face of the said technical play. In doing so, the quote could push buyers towards aiming the monthly high of 1.2813.
GBP/USD four-hour chart
Trend: Pullback expected