17 Apr 2020
Gold Price Analysis: Above $1,700 despite pullback, Firday’s close becomes pivotal
- Gold remains below the monthly rising trend line.
- A three-week-old horizontal line on the bear’s radar.
- Buyers will have to cross the ascending resistance line from late-February.
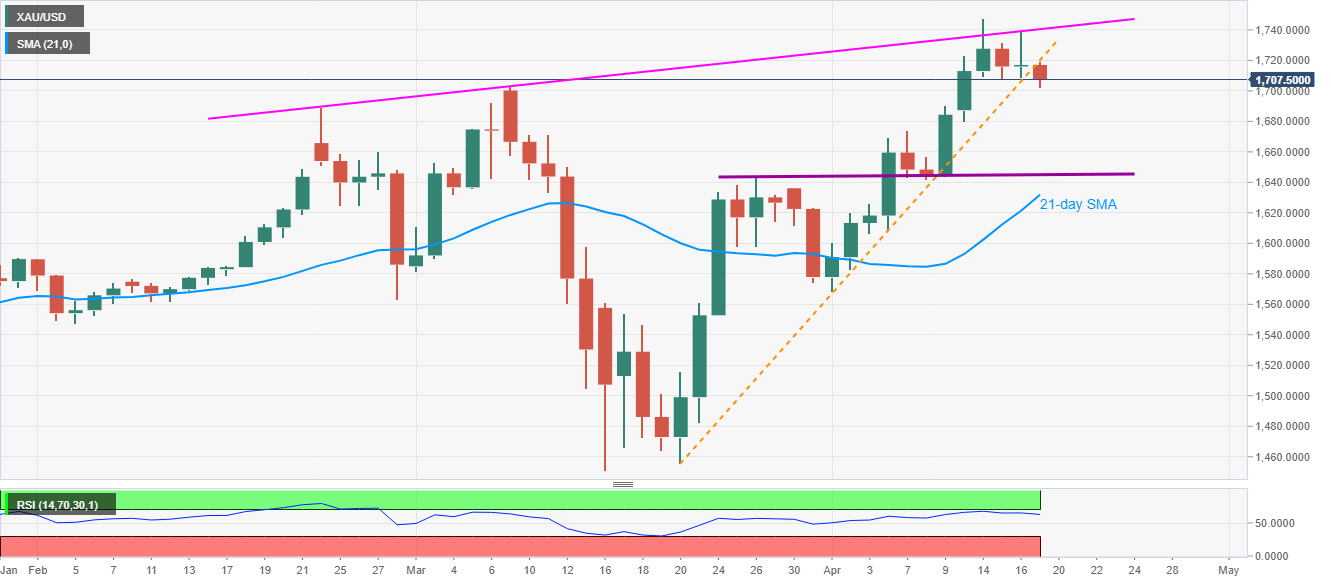
Gold prices extend the downside, currently -0.62% on a day to $1,707, post-breaking one-month-old rising trend line.
While sellers are targeting three-week-old horizontal support around $1,645/40 during the further declines, a daily closing below $1,720 becomes necessary for them to stay at the helm.
In doing so, a 21-day SMA level $1,631 will be their next target after breaking the aforementioned horizontal line around $1,640.
On the contrary, a daily closing beyond $1,720 will keep the bulls hopeful to confront an upward sloping trend line since February 24, 2020, at $1,740.50 now.
It’s also important to know that the bullion’s run-up beyond $1,741 could help it cross the latest top surrounding $1,748.
Gold daily chart
Trend: Pullback expected