DXY Technical Analysis: The leg lower in the index could re-visit 96.00
- The greenback remains well on the defensive so far this week, motivating the index to fall deeper into the negative territory near 96.30, or multi-session lows.
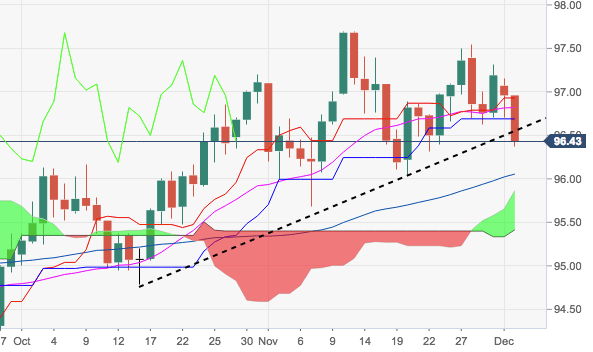
- In doing so, DXY has breached the key short-term support line, allowing for the continuation of the down move to, initially, the 96.00 neighbourhood, where align past lows and a Fibo retracement of the 2017-2018 drop.
- On the upside, there are no relevant hurdles until late-November’s peaks beyond 97.50.
DXY daily chart
Dollar Index Spot
Overview:
Today Last Price: 96.44
Today Daily change: -52 pips
Today Daily change %: -0.536%
Today Daily Open: 96.96
Trends:
Previous Daily SMA20: 96.84
Previous Daily SMA50: 96.19
Previous Daily SMA100: 95.64
Previous Daily SMA200: 93.94
Levels:
Previous Daily High: 97.15
Previous Daily Low: 96.71
Previous Weekly High: 97.54
Previous Weekly Low: 96.62
Previous Monthly High: 97.7
Previous Monthly Low: 95.68
Previous Daily Fibonacci 38.2%: 96.88
Previous Daily Fibonacci 61.8%: 96.98
Previous Daily Pivot Point S1: 96.73
Previous Daily Pivot Point S2: 96.5
Previous Daily Pivot Point S3: 96.29
Previous Daily Pivot Point R1: 97.17
Previous Daily Pivot Point R2: 97.38
Previous Daily Pivot Point R3: 97.61