5 Oct 2018
GBP/USD Technical Analysis: Bull flag sends Cable near 1.3100 figure
- GBP/USD main trend is transitioning back to bullish as the market broke above the bull flag formation and is trading above the 50-day simple moving average (not shown).
- GBP/USD is trading above the 50 and 200-period simple moving average while the RSI, MACD and Stochastics are constructive to the upside.
- GBP/USD bulls next objective is to break above 1.3100 and the 100-period simple moving average to target 1.3150 (September 21 low).
GBP/USD 4-hour chart
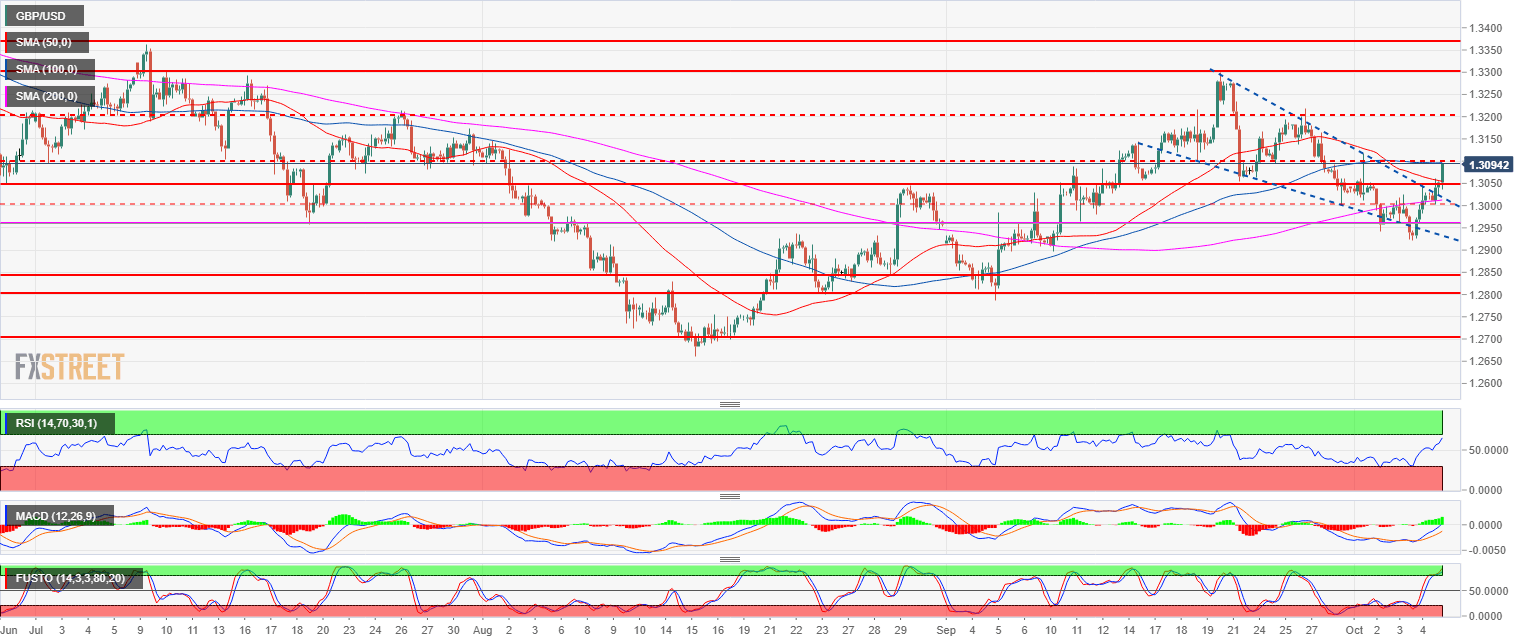
Spot rate: 1.3093
Relative change: 0.56%
High: 1.3099
Low: 1.3003
Main trend: Bullish
Resistance 1: 1.3100 figure
Resistance 2: 1.3150 September 21 low
Resistance 3: 1.3200 figure
Support 1: 1.3050 August 30 swing high, key level
Support 2: 1.3000 figure
Support 3: 1.2957 July 19 swing low
Support 4: 1.2900 figure