25 Sep 2018
AUD/USD Technical Analysis: backing down as tensions continue on trade
- The Aussie is seeing further downside in Tuesday's early sessions, facing back down below 0.7250 after peaking in the overnight session at 0.7263.
- China tensions continue to press down on risk assets in the Pacific-Asia region as Shanghai continues to lash out at the US over tariffs which came into effect yesterday.
- Today's bearish action sees the Aussie continuing to grind its way back into the 200-hour EMA at 0.7235, a major confluence with the 21-day EMA as well.
AUD/USD Chart, 1-Hour
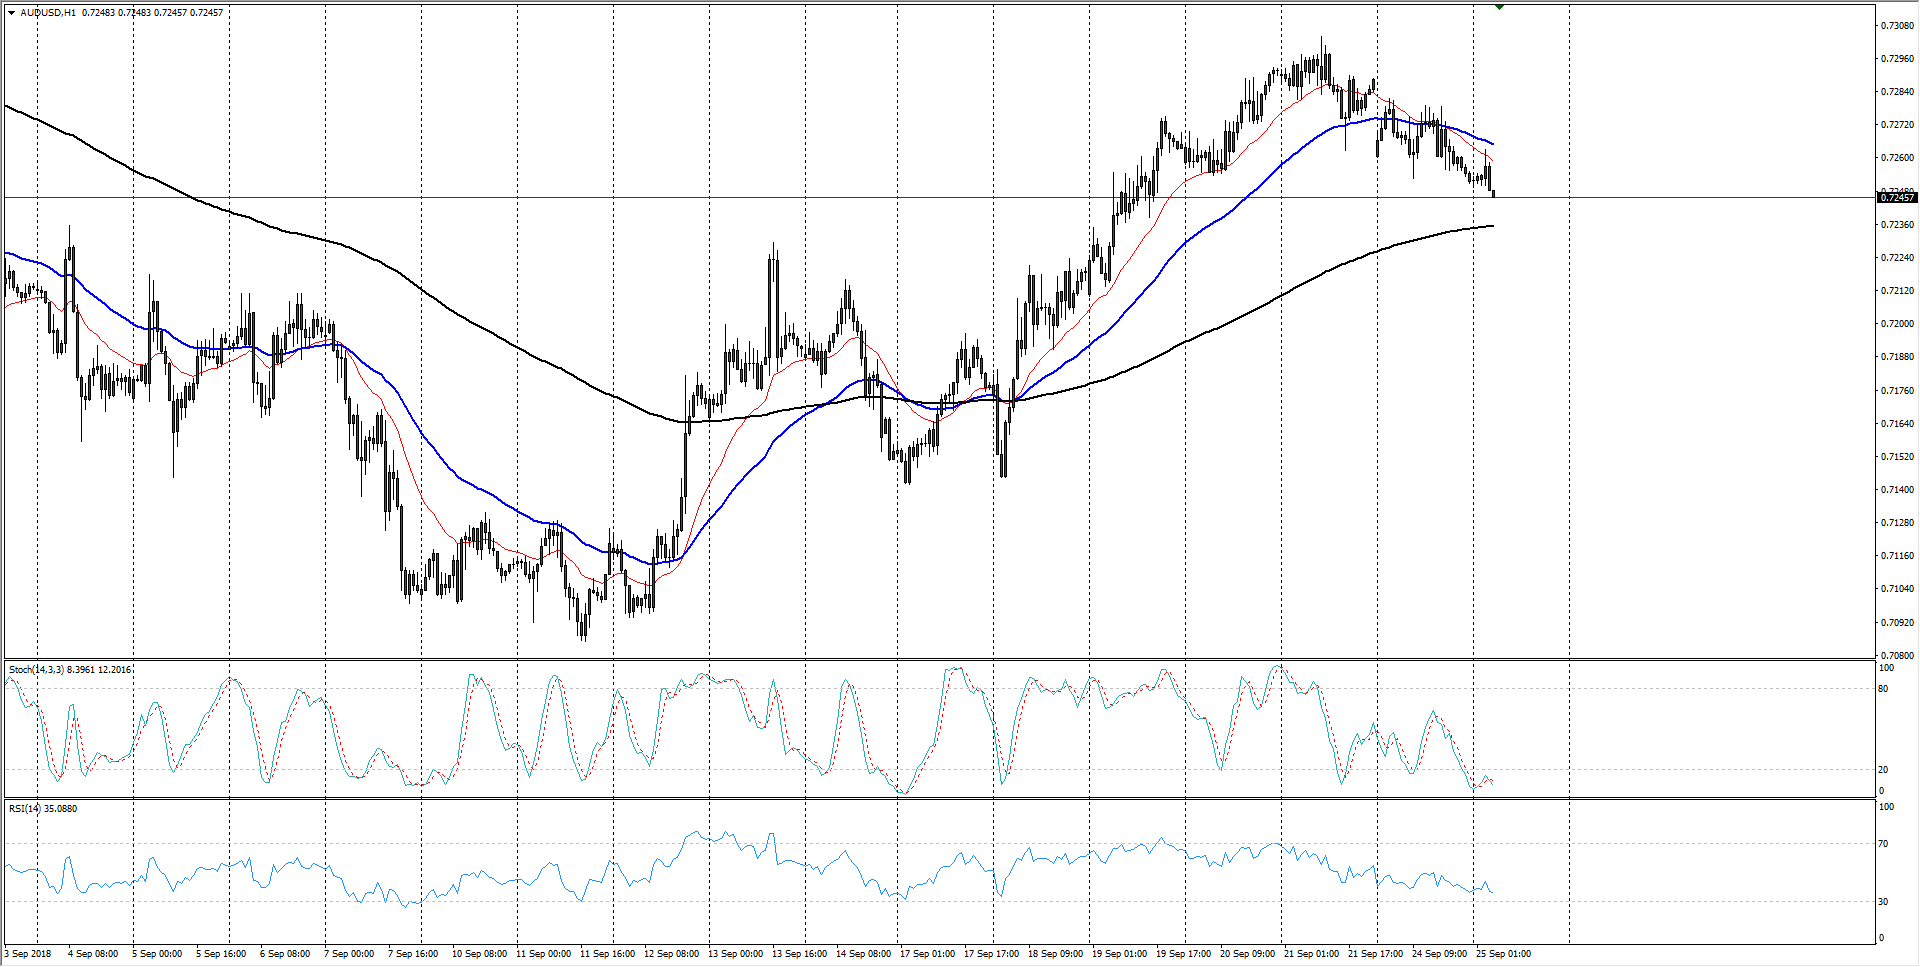
| Spot rate | 0.7245 |
| Week's change | -0.20% |
| Previous week high | 0.7304 |
| Previous week low | 0.7141 |
| Support 1 | 0.7235 (200-hour EMA, 21-day EMA) |
| Support 2 | 0.7216 (September 16th swing high) |
| Support 3 | 0.7200 (major technical level) |
| Resistance 1 | 0.7264 (50-hour EMA) |
| Resistance 2 | 0.7289 (50-day EMA) |
| Resistance 3 | 0.7304 (previous week high) |