EUR/USD Technical Analysis: EUR/USD erases Monday’s losses - Bulls challenge 1.1600 figure
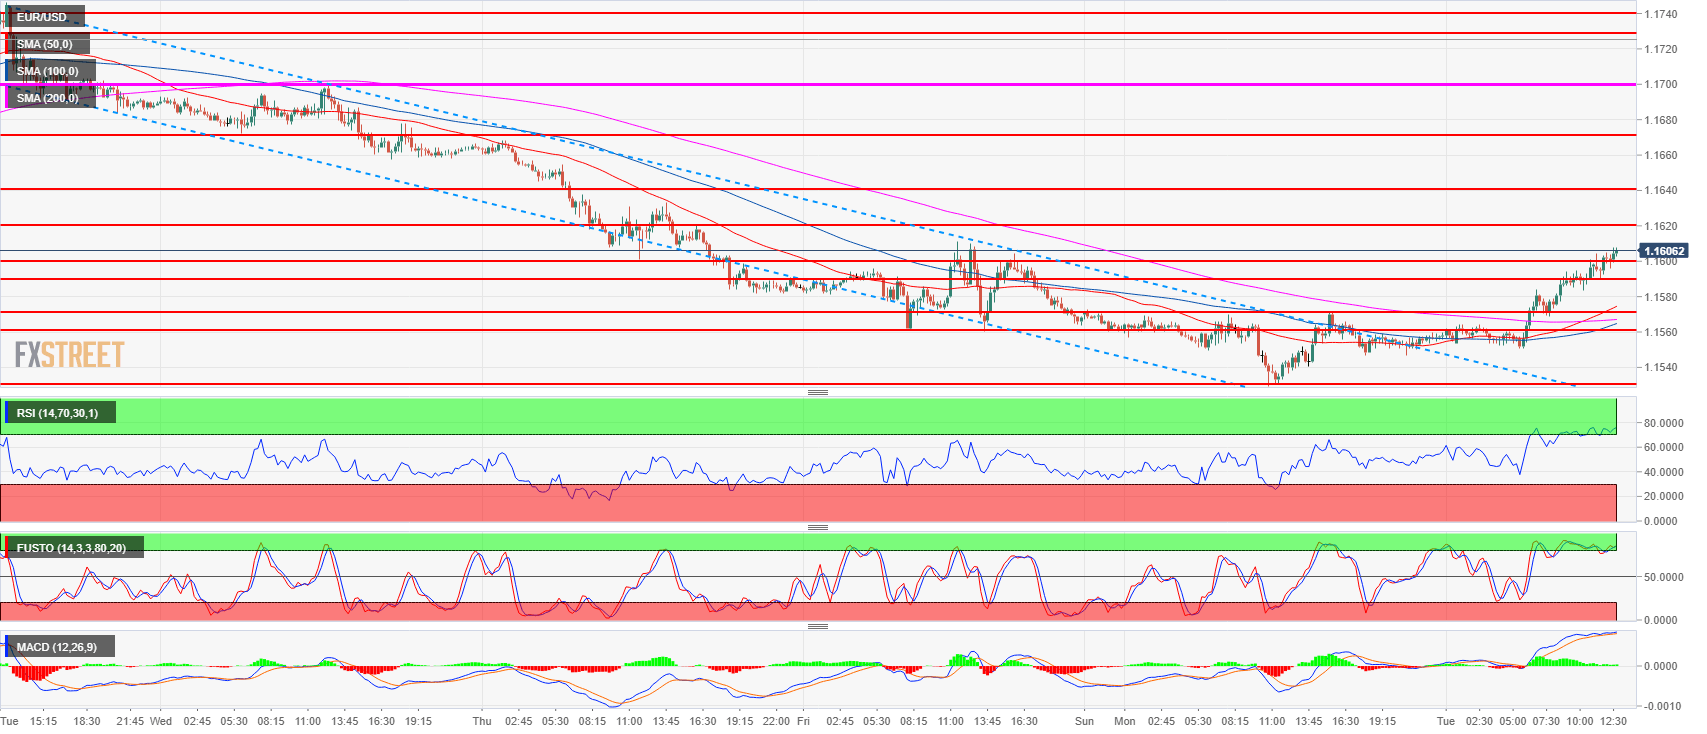
- EUR/USD bulls took the lead on Tuesday pushing the single currency back above the 1.1600 level. EUR/USD is currently challenging last Friday’s high at 1.1611. While the main trend is bearish, the bulls managed to create a double bottom with the June 28 low.
- The 50-period simple moving average has crossed above the 200-period SMA suggesting that the bullish momentum is intensifying. Bulls objective is to now to clear the 1.1620 resistance in order to drive EUR/USD towards 1.1640-1.1649 area.
- Given the short-term bullish momentum, it is more likely that pullbacks down are going to become buying opportunities for the time being. Supports are seen near the 1.1571 level (Monday’s high) and 1.1590 intraday congestion zone.
EUR/USD 15-minute chart
EUR/USD daily chart
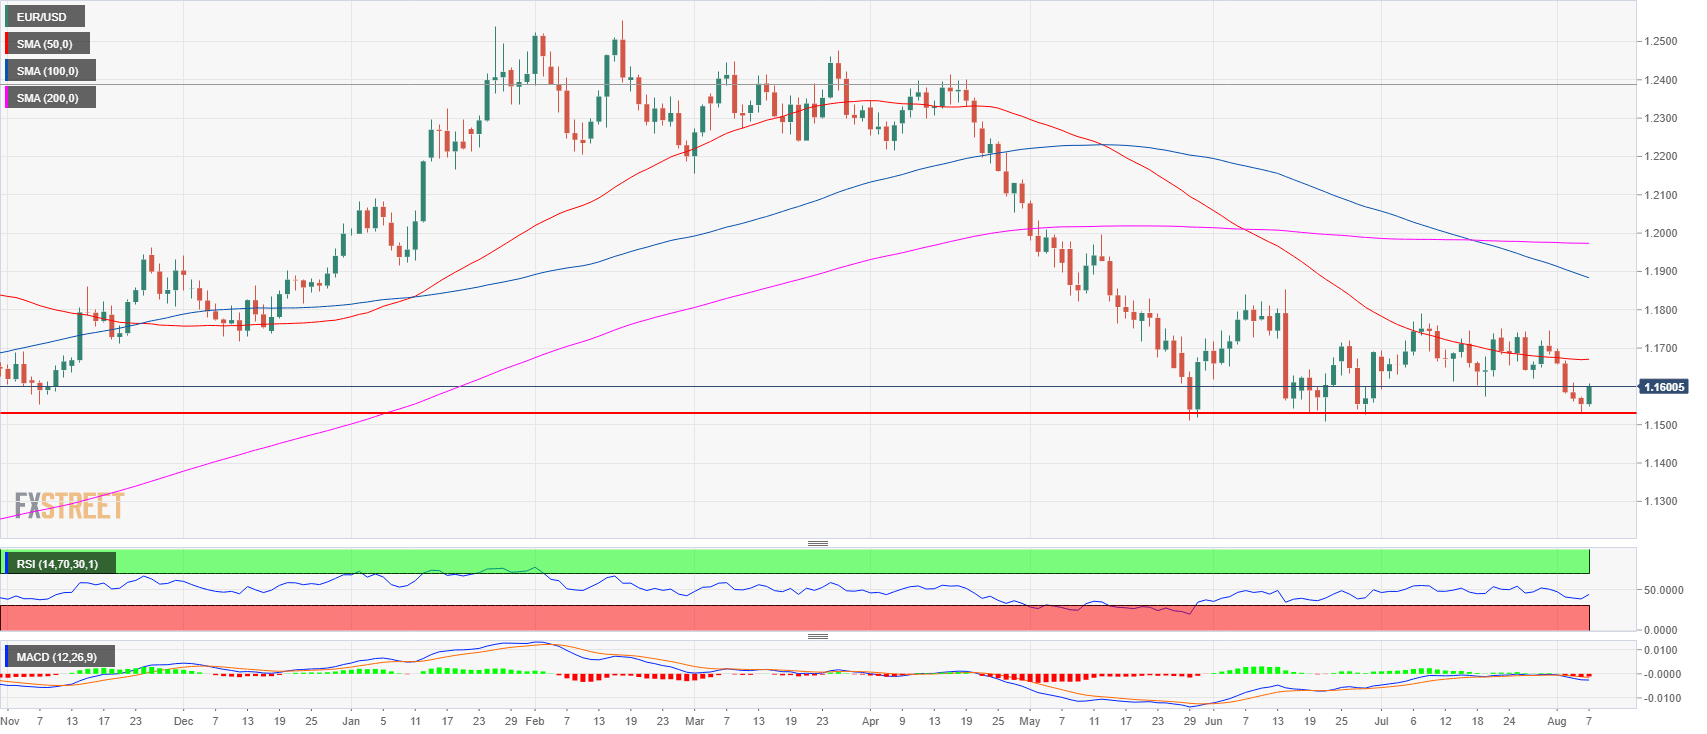
Spot rate: 1.1600
Relative change: 0.40%
High: 1.1608
Low: 1.1546
Trend: Bearish / Double bottom with June 28 low at 1.1527, bullish pullback
Resistance 1: 1.1600-1.1620 area, figure and July 27 low
Resistance 2: 1.1640-1.1649 area, key level and July 12 low
Resistance 3: 1.1672 June 27 high
Resistance 4: 1.1700 figure
Resistance 5: 1.1750 supply level
Resistance 6: 1.1760-1.1795 supply levels
Resistance 7: 1.1851-1.1854 area, June high and 38.2% Fibonacci retracement from mid-April-May bear move
Support 1: 1.1571 Monday’s high
Support 2: 1.1527 June 28 low
Support 3: 1.1508 current 2018 low
Support 4: 1.1370 July 13, 2017 1.1370 low