Natural Gas Price Analysis: XNG/USD bounces off 10-EMA to print mild gains around $2.37
- Natural Gas picks up bids to reverse the previous day’s retreat from one-week high.
- Double tops around $2.43, 50-EMA challenge XNG/USD bulls.
- Impending bull cross on MACD, sustained bounce off 10-EMA keeps buyers hopeful.
- Weekly support line, ascending trend line from April add to the downside filters.
Natural Gas (XNG/USD) Price prints mild gains around $2.37 as XNG/USD bears lick their wounds amid early Friday. In doing so, the energy instrument recovers from the 10-Exponential Moving Average (EMA) while also justifying the looming bull cross on the MACD indicator.
However, the double tops marked at $2.43, quickly followed by the 50-EMA hurdle of $2.45 challenged the Natural Gas buyers.
It should be noted that the XNG/USD run-up beyond $2.45 enables the energy bulls to aim for the 50% Fibonacci retracement of its March-April fall, around $2.60.
Following that, the previous monthly high of around $2.81 gains major attention as being the last defense for the XNG/USD buyers.
On the flip side, a daily closing below the 10-EMA level of $2.35 isn’t an open invitation to the Natural Gas bears.
That said, a one-week-old ascending support line near $2.33 can challenge the XNG/USD bears afterward.
Above all, the Natural Gas buyers remain cautious ahead of witnessing a daily closing below a two-month-old rising support line, close to $2.18 at the latest.
XNG/USD: Daily chart
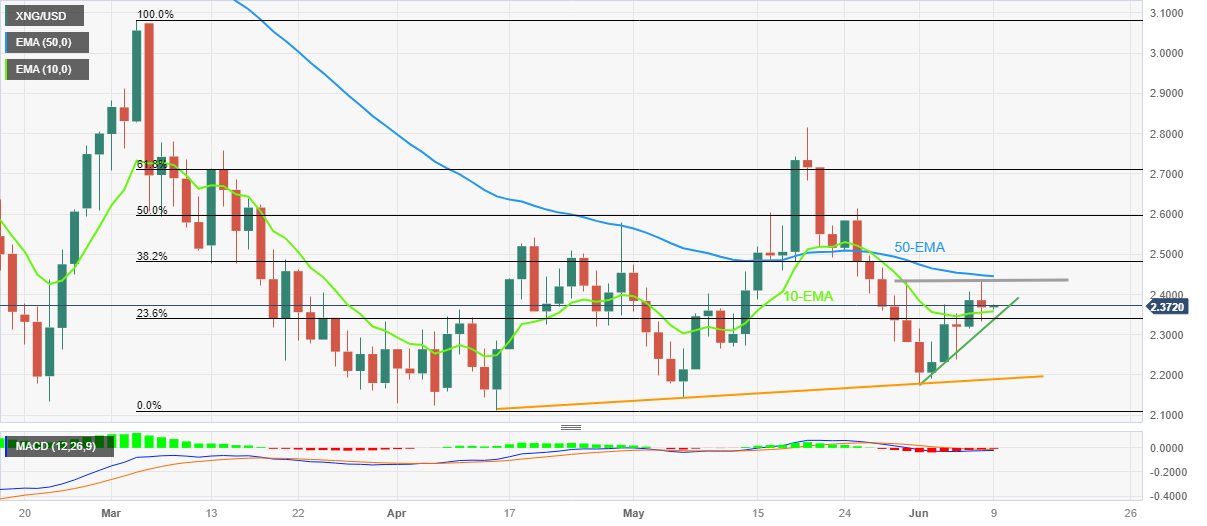
Trend: Further upside expected