Silver Price Analysis: XAG/USD seems vulnerable near 38.2% Fibo., break below 100-SMA awaited
- Silver edges lower on Monday and reverses a part of Friday’s recovery from the 100-day SMA.
- The technical setup still favours bears and supports prospects for a further depreciating move.
- A sustained strength beyond the $25.00 mark is needed to negate the near-term negative bias.
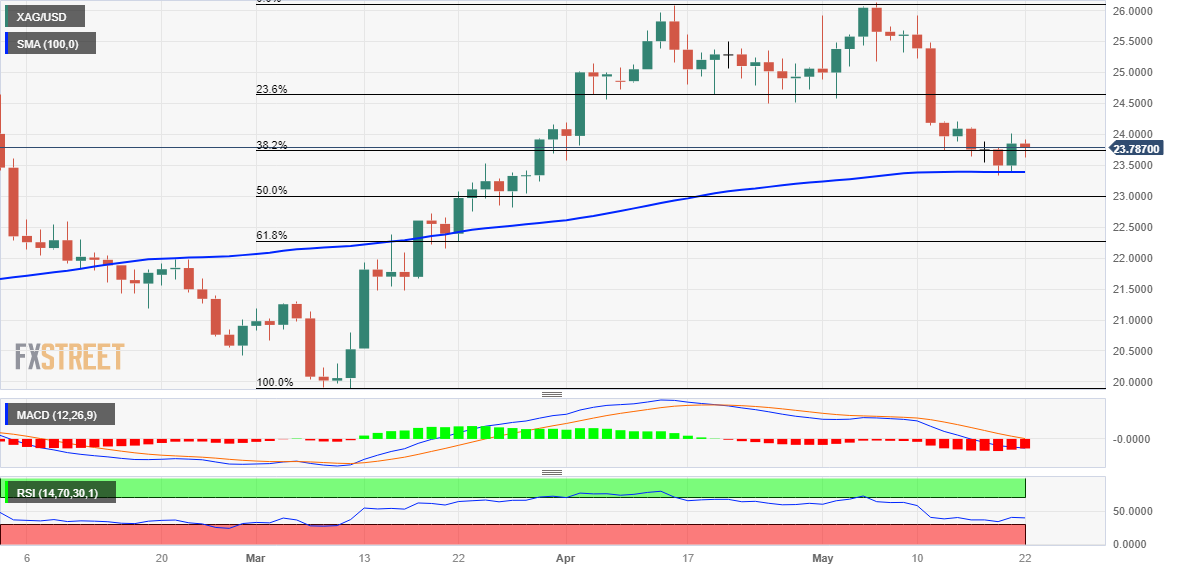
Silver struggles to capitalize on Friday's goodish rebound from the 100-day Simple Moving Average (SMA) and meets with a fresh supply on the first day of a new week. The white metal remains on the defensive through the early European session and is currently trading around the $23.75 region, representing the 38.2% Fibonacci retracement level of the March-May rally.
From a technical perspective, the recent breakdown through the $24.60-$24.50 horizontal support, coinciding with the 23.6% Fibo. level, favours bearish traders. Moreover, oscillators on the daily chart are holding deep in the negative territory and are still far from being in the oversold zone. This, along with Friday's failure near the $24.00 mark, suggests that the path of least resistance for the XAG/USD is to the downside.
That said, it will be prudent to wait for acceptance below the 100-day SMA, currently pegged near the $23.35-$23.30 area, also marking the lowest level since late March touched last Thursday, before placing fresh bearish bets. The XAG/USD might then accelerate the fall towards 50% Fibo. level, around the $23.00 mark before eventually dropping to the $22.65-$22.60 support en route to the $22.30-$22.25 region, or the 61.8% Fibo. level.
On the flip side, momentum back above the $24.00 round figure might attract fresh sellers near the $24.25 supply zone. Any subsequent strength is more likely to remain capped near the $25.00 psychological mark. This is followed by the $25.30-$25.40 hurdle, which if cleared decisively should allow bulls to make a fresh attempt to conquer the $26.00 mark and challenge the YTD peak, around the $26.10-$26.15 area touched earlier this month.
Silver daily chart
Key levels to watch